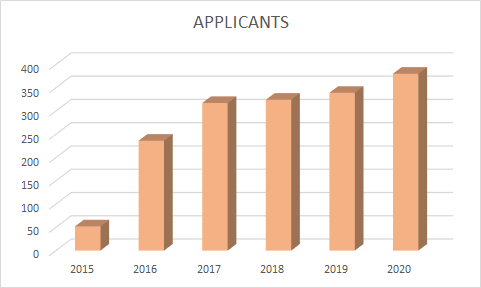
The team was formed, and gave our first test, in September 2015. We have kept statistics since that time, although we have captured more details over the years and looked at the numbers in different ways. One way is the percentage of new versus renewing applicants. A number that significantly changed through 2020, and is continuing, is the number of people that take more than one exam at a time, including all three.
We also saw a significant drop in our “no-shows” through 2020, from an average of 24% to 8%. We hope that trend continues.
One set of data we started to capture when we resumed testing in May 2020, after a 2-month paused because of COVID, was the distance that people were travelling to come and test with us. We’ll add that data in the near future.
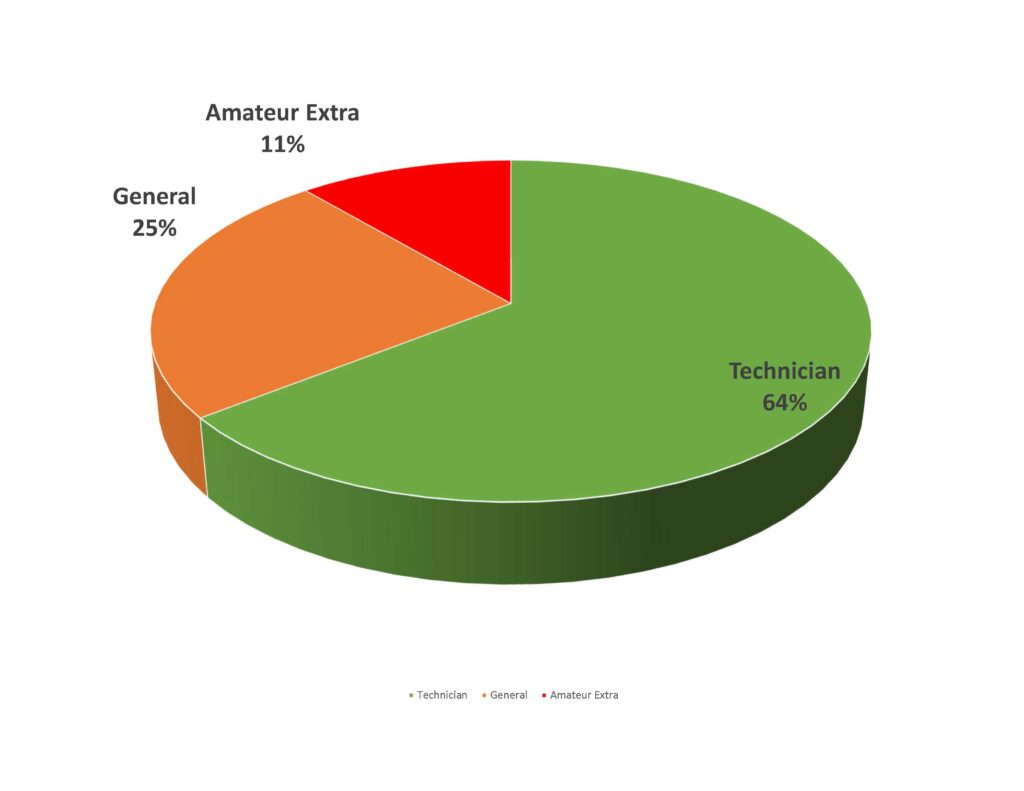
As of the end of May 2020
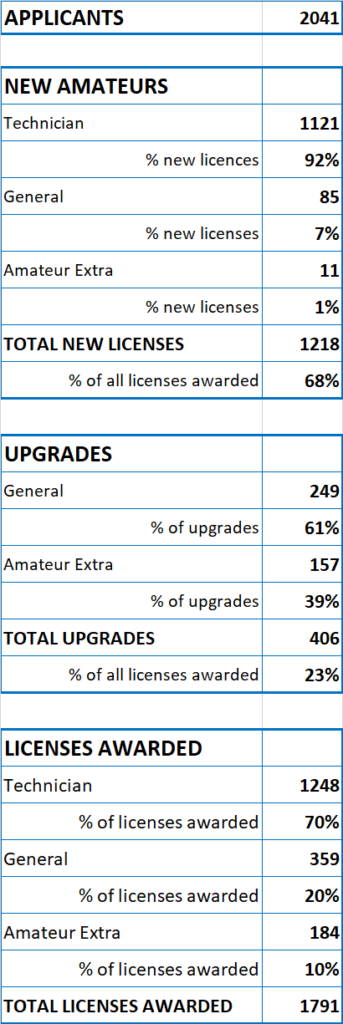
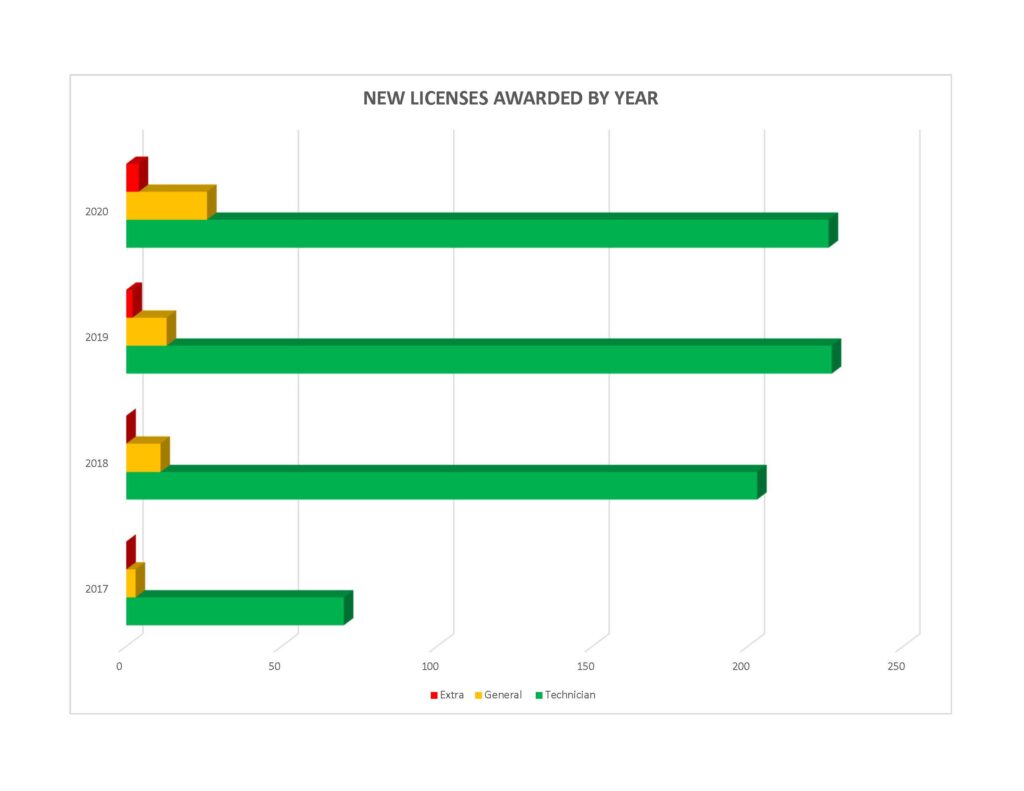
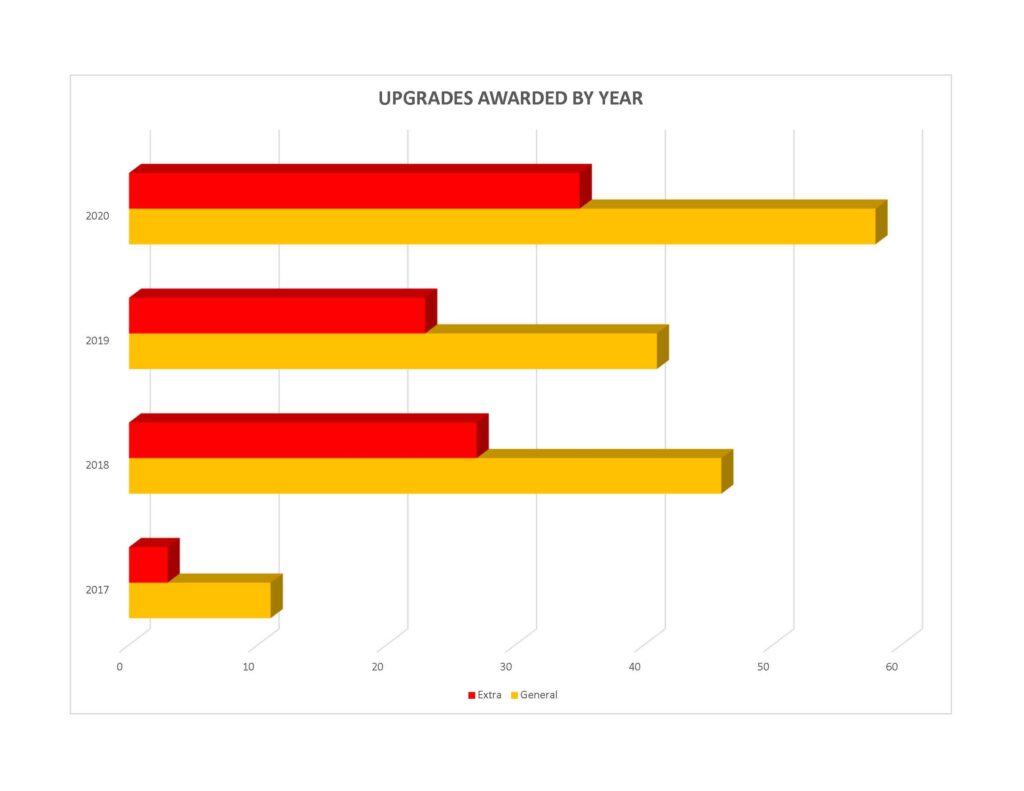
Licenses awarded in 2020